Brief, Layman Oversimplification of Reinforcement Learning Using Basketball
I think examples are always a good way of learning something. So let’s see how one of my favorite stories in sports lends itself to reinforcement learning.
About six years ago, my favorite basketball team, the Philadelphia 76ers, were finishing another year of mediocrity. In comes Sam Hinkie, the new person in charge of the team. Sam saw the Sixers like any agent in a reinforcement laerning model—how can we maximize the long-term gains? (okay, maybe I’m starting to sound like a banker, too). First, Sam realized the best thing to do was win a championship (or maybe a few) in the long-run rather than continuing to pass for mediocrity. It should be noted, this policy in of itself is a departure from what other teams do, especially cause teams tend to think in the short-term, especially because their bosses try to keep their jobs (see - perverse incentives).
Let’s give a name to our goal of winning. This will be the reward, $r$. We’ll create the following distribution of reward, or utility, derived from ranking at a certain position in the NBA. Note, by the way, I chose this subjectively, but I’ve been following basketball for my whole life now, so clearly I must be some authority or something.
R Code
library(tidyverse)
library(xkcd) # instructions to download and implement package: https://cran.r-project.org/web/packages/xkcd/vignettes/xkcd-intro.pdf
library(extrafont)

mytibble <- tibble(
  Ranking = 102:1,
  Utility = c(900, 600, 1.1**Ranking[1:100]/40))

xrange <- range(mytibble$Ranking[72:102])
yrange <- range(mytibble$Utility[1:30])

mytibble <- mutate_at(mytibble, vars(Ranking), list(~103 - .))

ggplot(data=mytibble, aes(x=Ranking, y=Utility)) +
  geom_line(size = .5) +
  labs(title = "Utility as a Function of Team's Relative Position in the NBA",
       caption = "The lower the x-axis value, the better the team",
       y = "Reward, in utils") +
  theme(axis.text.y=element_blank(),
        axis.ticks.y=element_blank()) +
  scale_x_continuous(breaks = c(1, 2, 3, 10, 20, 30)) +
  xkcdaxis(xrange, yrange)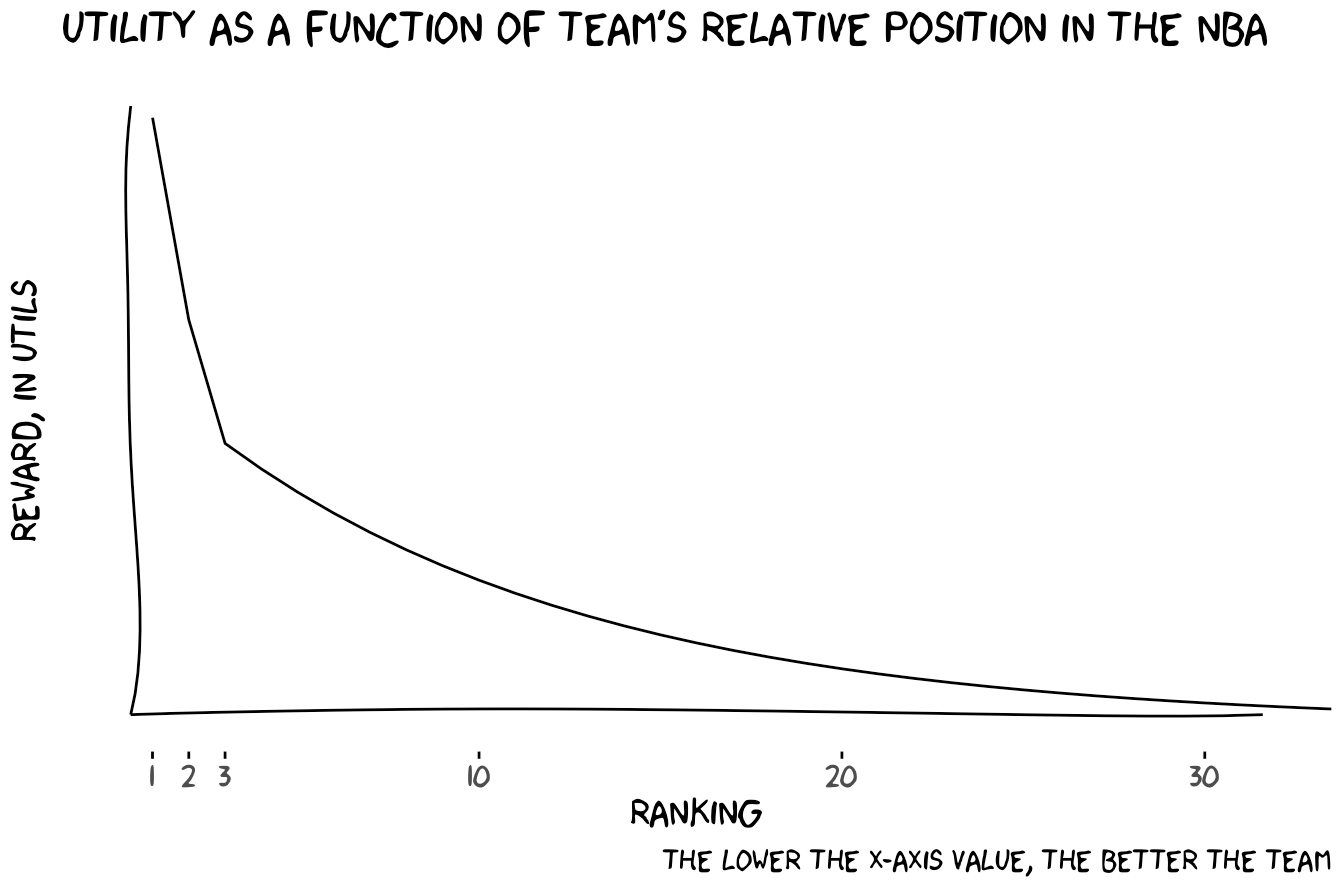
Now, reinforcement learning implies some kind of learning, obviously. Where’s the learning in this case? Sam realized he can just tap into the many existing seasons’ and teams’ data to see which strategies they took and how they fared. In other words, it’s like using a matrix with the following information—one axis for every organization, the other axis for each year, text representing the strategy at that time, and the cells’ shading representing the resulting, say, utility or winningness. Then it’s just like a matching game! Aggregate and compare cells with different ‘strategies’, or actions, and look for the darkest shading, or best corresponding outcome. We’ll refer to actions with $a$.
R Code
library(nbastatR)
library(tidyverse)
library(RColorBrewer)

all_teams_all_years <- teams_annual_stats() # may take a couple minutes to load

set.seed(128)
df <- left_join(all_teams_all_years, nba_teams_seasons(), by = "idTeam") %>%
  dplyr::mutate(slugTeam=factor(slugTeam,levels=rev(sort(unique(slugTeam)))),
                slugSeason = as.integer(gsub("-..", "", slugSeason)),
                winLag = lag(pctWins),
                action = sample(c("O", "N", "G"), n(), replace = TRUE))

p <- ggplot(df, aes(x=slugSeason,y=slugTeam,fill=pctWins)) +
  geom_tile() +
  scale_x_continuous(breaks=seq(1950, 2020, 10)) +
  scale_fill_gradientn(colours = colorRampPalette(brewer.pal(8, "Blues"))(25),
                       breaks=c(0),labels=c(""),
                       limits=c(0,1)) +
  theme(panel.background=element_rect(fill="white"),
        axis.text.x = element_text(angle=45),
        axis.ticks=element_blank(),
        legend.title = element_text(size =8)) +
  labs(x = "Season", y = "Team", fill = "Win %\n(reward)",
       caption = "The actions are O, G, N, which stand for 'Offloading talent', 'Gaining talent', and 'Remaining neutral'\n\nNote- these values were generated randomly, solely for demonstration purposes")

p + geom_text(aes(label = action), size = 2)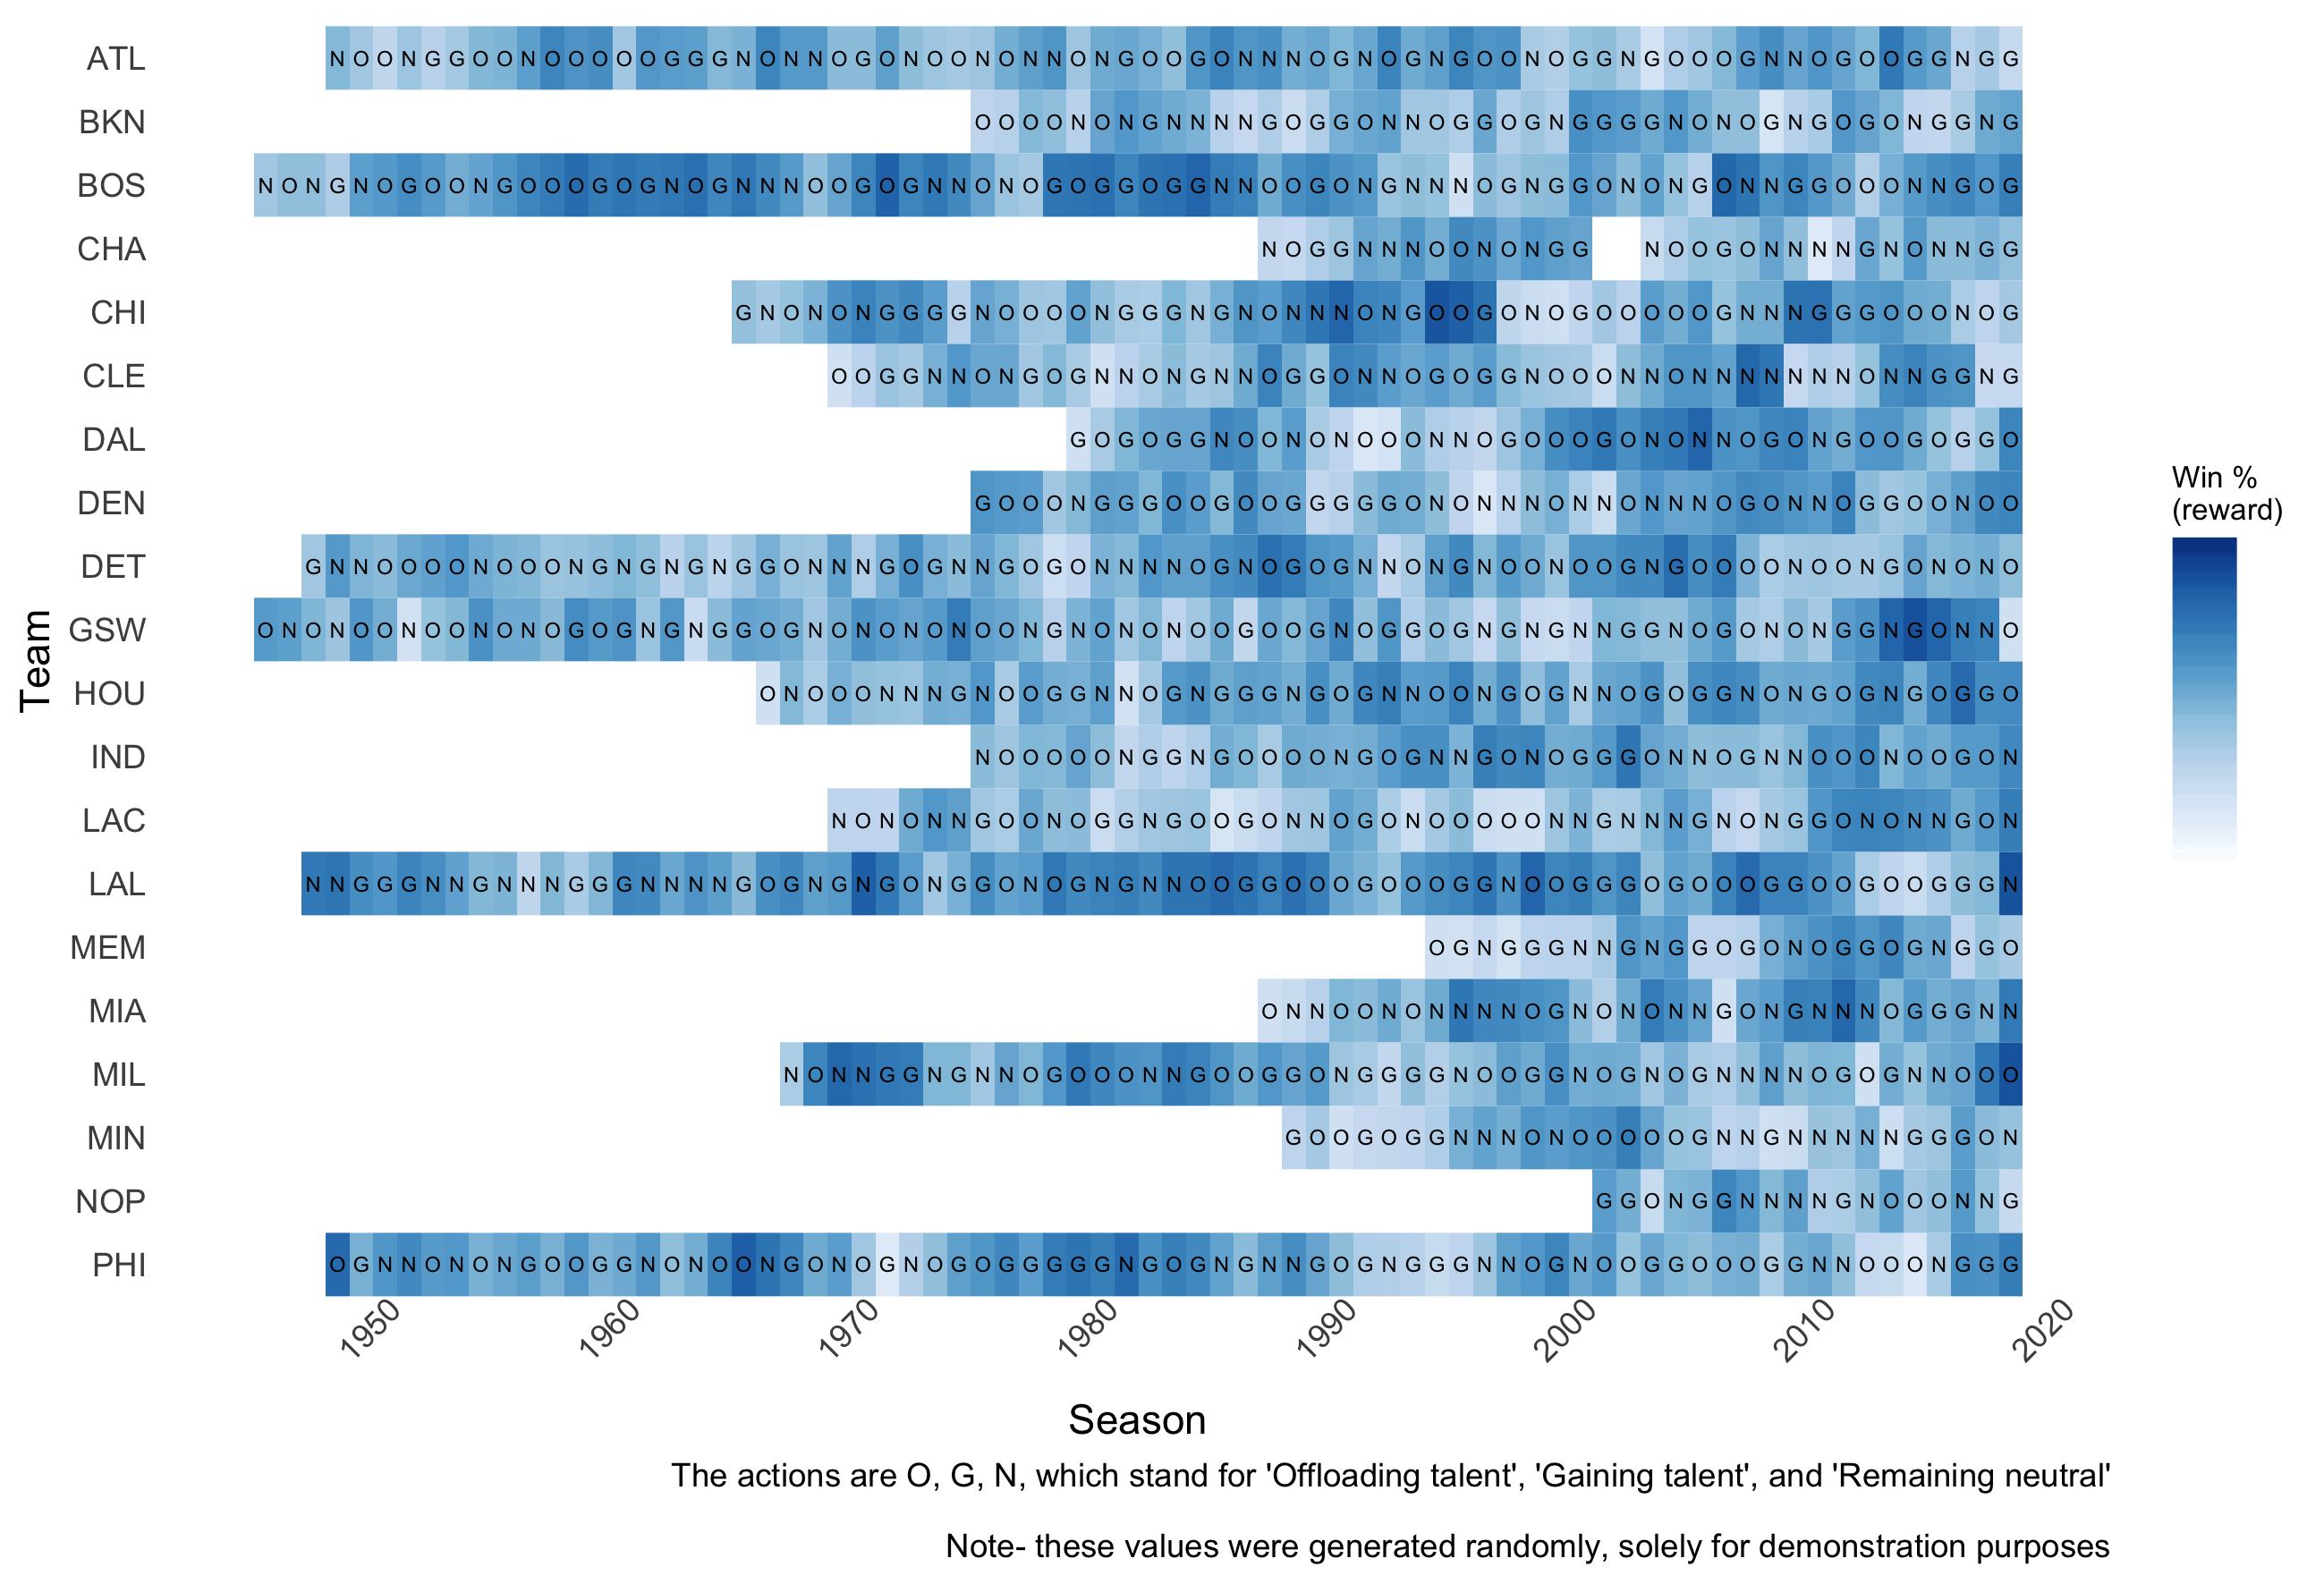
The action we choose when the first season begins, in this example in 2013, is $A_{2013}$; more generally, the action we choose among all possible actions takes the form of $a \in \mathcal{A}$.
That action conveys an immediate reward at the end of the season, in this example in 2014. The immediate reward is then $R_{2014}$, and more generally the reward is $r \in \mathcal{R}$. Notice the reward always conveys one step (later defined as ‘state’) after the action.
The story could end here. But now it gets more fun. What the above matrix neglects is (sorta duh) where teams are starting from each year. Let’s say two teams’ strategies are, respectively, acquiring top players and offloading their best players for top players in the future. Then to gauge the success of these strategies, 1) as mentioned before, you’d want to determine how that strategy in the short-term played into long-term success, and 2) you’d want to account for the teams’ quality in the first place. We might see a bad team that then acquires new talent still perform worse than a top team offloading talent, just because the two teams started so far apart. But we wouldn’t want to then conclude that gaining talent is unrelated to success. Instead, let’s change the cell font color to reflect that some teams ‘started from the bottom.’ We’ll call this the state, $s$.
R Code
p + # from the code in the code block above
  labs(color = "Season starting\npoint (state)") +
  geom_text(aes(label = action, colour = winLag), size = 2) +
  scale_color_gradientn(colours = colorRampPalette(brewer.pal(8, "Greens"))(3),
                        breaks=c(0),labels=c(""),
                        limits=c(0,1))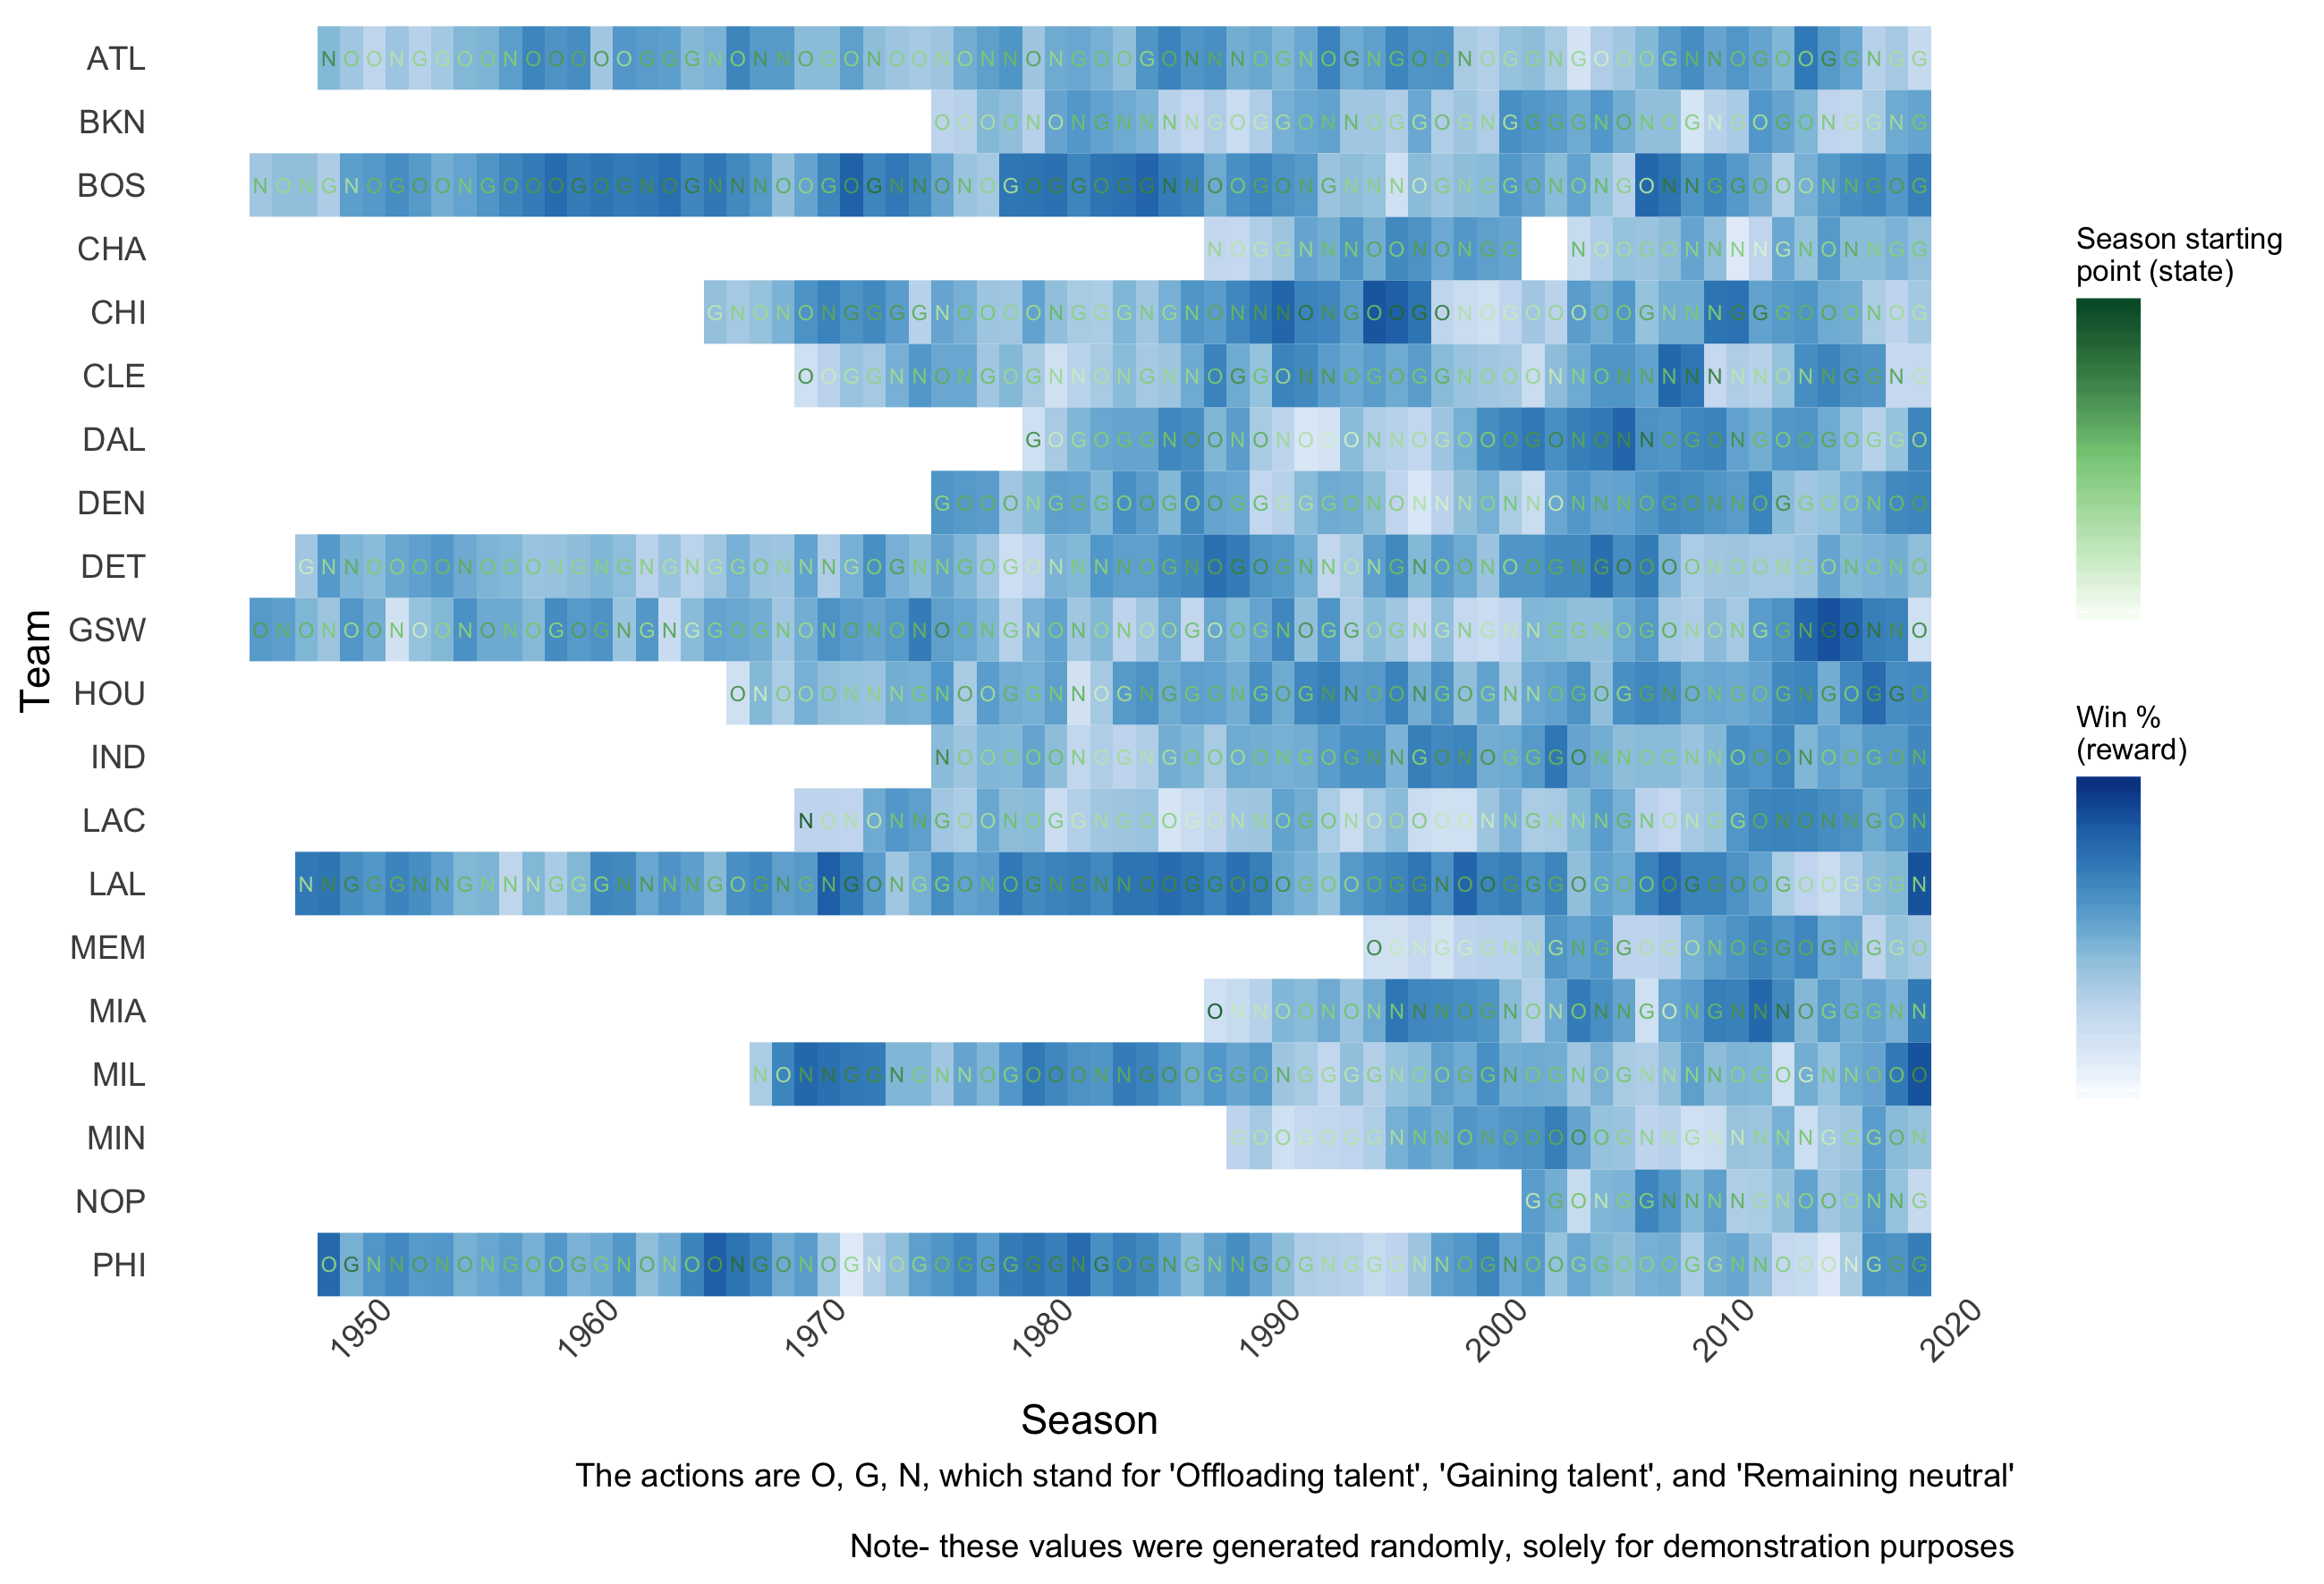
Back to the Sixers. Sam gleans the hundreds of combinations of states, strategies, and ensuing rewards. He realized a lot of middling teams didn’t employ either of the two aforementioned strategies, gaining or selling players. Instead, they just stood pat (we’ll call this a third strategy). But, he also noticed the top teams tended to stink only a few years prior, before getting the pick of the litter of college athletes in the NBA Draft (in the NBA, crucially, the worst teams get the top picks of ‘rookies’). In contrast, middling teams hardly started contending for championships by ‘staying the course’ with the same team.
So, controversially (and boy do I mean controversially), Sam sold off the Sixers’ talent in exchange for future, additional NBA Draft picks. In other words, some good ol’ intertemporal choice (plug for my old graduate mentor’s first-author pub). And sure enough, after several seasons of sending hard-to-watch (that’s an understatement) teams to ‘compete’, and lose, the Sixers have become one of the top teams in the league (granted, they don’t suddenly have a sort of dynasty like the Golden State Warriors, but for one the NBA basically fired Hinkie midway through the plan because it looked bad for the NBA for a team to repeatedly lose almost ‘on purpose’, also known as ‘tanking’).
If you were to compare the Sixers’ finish on my subjective utility chart versus the Detroit Pistons, who were also a middling team about six years ago, you’ll see—the Pistons DET have been stuck in mediocrity like a hatchback in the mud (pun INtended), while the Sixers PHI have ascended and may well win a championship in the near future.
Notice that before, I said the Sixers could either continue to sell players or stay neutral, and I didn’t say they might gain players. That’s because of another way the NBA works. The best players, basically, only go to the top teams when they have the ability to join a new squad (just look at Demarcus Cousins, or shoutout to Amrith, my dear OKC fan , Kevin Durant). Six years ago, the Sixers weren’t good enough to acquire top talent. This is another facet in reinforcement learning (see, it’s not all about basketball). At different junctures, or states, only some of potentially all the strategies are available. That’s why the Sixers had to lose to get good talent—that was the only real strategy for doing so, there was no alternative if they wanted to win.
The final thing I’ll say about this story is a somewhat small detail about the NBA Draft. I said before that the worst teams get the first picks for rookies. That’s true, but there is some randomness in deciding the order of the picking (the NBA actually has a “Lottery” to determine the order). So finishing worst isn’t a guarantee for the top pick. Things are a little spicier more stochastic. And that’s true of reinforcement learning models—there is a transition probability, meaning most of the time it’s not guaranteed that taking an action in a certain state leads to the next state (say, losing on purpose leading to the top pick). We’ll refer to the probability of an action taking you from one state to the intended state as $P_a(S_1, S_2)$.
Let’s put this all together. We’re going after a reward. We have what is basically a matrix of how different actions (e.g. tanking to get a top pick) correlate with long-term success, though there’s no guarantee that taking an action in a given state will lead to the desired new state (and also, not all the actions we’d like to take are available in every state). Using lingo from a Markov decision process, here are our variables for the Sixers six years ago:
- $S_{2013}$ = 19 (19th-best of 30 teams)
- $A_{2013}$ = offloading talent
- $P_{offload}(19, 30)$ = say, 40% (Probability of descending from the 19th to 30th-best team (and winning the draft lottery for top pick))
- $R_{offload}(19, 30)$ = negligible (see top graph)
An important term I haven’t mentioned yet is called a ‘policy’, $\pi$. I like to think of a policy like a function with a bunch of if-else clauses. A policy says, if you’re in state x, do $A_x$. So for each possible state you can be in (in the story’s case, being the first, last, or 2-29th-best NBA team) the policy tell you which action to take (tank, win, stay the course, just never become the New York Knicks [hi dad]).
A policy doesn’t have to be the optimal policy. The optimal policy, $\pi_*$, is what would maximize your reward/utility given the long-term time course (notice, by the way, I’m being fuzzy about the exact time scale; the exact time-scale is more case-specific). That means the policy leading to the most utility at $S_1$ might lead you in the wrong direction for the long-term. Below is a summary of the policy the Sixers followed after Hinkie joined them, which forms a sequence.
At this point, it’s worth introducing the terms ‘model-based’ and ‘model-free’ reinforcement learning. Model-free characterizes the story so far. The agent does not have an intuitive idea why certain actions during certain states yield particular rewards. They just track their actions and adjust like trial and error. In contrast, model-based learning entails an understanding of this action-reward relationship. A change in the NBA’s rules might render the stored seasons’ and teams’ data obsolete. That might leave the model-free learner starting from scratch. A model-based learner, however, can contextualize the change, and integrate it into an updated model.
Probably better explainers than this:
- Lilian Weng’s primer
- Richard S. Sutton and Andrew G. Barto’s textbook
- Monica Dinculescu’s primer (with otters)